I tend to spend a fair amount of time looking at a player’s statistics in an attempt to really understand where their strengths and weaknesses are, particularly in the putting and scoring arena. The primary stats we have to work with are GIR’s, Scrambling, Putts Gained, and Approach Shot Proximity, but I still often find I can’t quite summarize a player’s round from these.
For example, a player can hit 14 greens and shoot even par or shoot 6 under par, but what was the difference in performance that caused the difference in scores? Putts Gained certainly helps to clarify his putting performance, but not his approach proximities. And the Approach Proximity stat is just an average and doesn’t give birdie opportunities. For example an Approach Proximity of 25 feet doesn’t tell whether a player had only 25-foot birdie putts, or whether he had five 10-foot birdie putts and one 100-foot putt.
What I really need to understand comes from an idea I got from Dr. Bhrett McCabe called “In Position”, meaning how often when you hit the green were you in position to make a birdie (generally inside 20 feet). If a player is hitting the green more than 20 feet from the hole, then he can’t be expected to make a lot of birdies. In Position is a great stat to look at but I still want more—how close is a player hitting it and what are his expected number of birdies given his ball striking performance.
Lately Jamie Donaldson (Senior AimPoint Instructor for Europe) and I came up with some new metrics called the Expected Birdie Percentage (EBP) and the Actual Birdie Percentage (ABP). The idea is simple: when a player hits the green in regulation, what were the odds of him making a birdie (EBP), and how did he perform relative to those odds (ABP)?
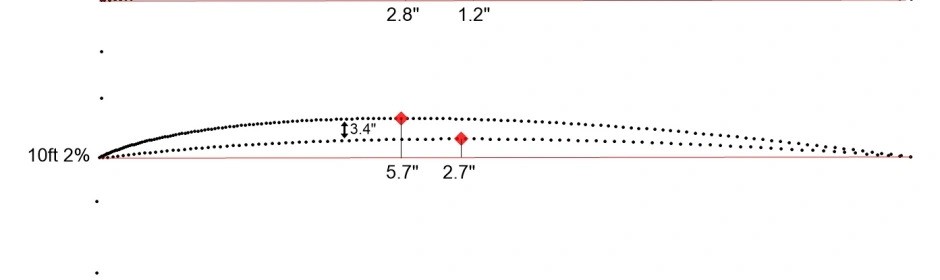
What we did is look at the probability of making birdies given the length of the player’s first putt after hitting the green in regulation, or his second putt if hitting a par 5 green in two shots (for now I’m ignoring chips-ins, hole-outs, etc.). For example, a 3 foot birdie putt should be made 99% of the time, and a 15 foot birdie putt should be made about 24% of the time. A player’s average make probability is his EBP. A player’s actual make percentage of those putts is his ABP.
The results were interesting to say the least[1]. The players with the top 5 highest EBP’s are:
| Rank | Player Name | EBP | Driving Dist. Rank | Money Rank |
| 1 | Watson, Bubba | 39.5% | 1 | 1 |
| 2 | McIlroy, Rory | 38.3% | 5 | 28 |
| 3 | Holmes, J.B. | 36.2% | 4 | 27 |
| 4 | Johnson, Dustin | 35.8% | 2 | 3 |
| 5 | Woodland, Gary | 35.8% | 15 | 25 |
All are very long hitters who can hit par 5 greens in two shots. This finding supports Mark Broadie’s research in Every Shot Counts suggesting that long shots into greens are highly important, particularly the range of 175-225 yards. What we may be seeing is that these are the big boy’s second shot into the par 5 greens, setting up eagles and easy birdies, versus long approaches into par 4’s which will generally lead to a two-putt par.
We can also look at how many birdies a player actually made after a GIR (ABP), and the top 5 players are:
| Rank | Player Name | ABP | Money Rank |
| 1 | McIlroy, Rory | 41.8% | 28 |
| 2 | Schwartzel, Charl | 37.8% | 68 |
| 3 | Woods, Tiger | 37.8% | n/a |
| 4 | Watson, Bubba | 37.8% | 1 |
| 5 | Walker, Jimmy | 37.7% | 2 |
No big surprises there, but why is Woods ranked low in EBP and high in ABP?
Then we compare the expected birdie percentage (EBP) and the actual birdie percentage (ABP) and calculated the difference between the two into a metric we called Gain. A players Gain is how many more percentages of birdies the player made above his expectation, due to putting. The top 5 players in Gain are:
| Rank | Player Name | Gain | Putts Gained Rank |
| 1 | Woods, Tiger | 11.5 | n/a |
| 2 | Every, Matt | 6.2 | 3 |
| 3 | Walker, Jimmy | 5.2 | 4 |
| 4 | Donald, Luke | 4.7 | 6 |
| 5 | Loupe, Andrew | 3.9 | 11 |
This means these players had the highest level of over-performance in making birdies relative to their ball striking proximities. A Gain of 0.0 means you are meeting the tour average for converting birdie putts, while a negative Gain means you are under-performing and leaving birdies on the table.
These metrics can be very useful in understanding a player’s round because it gives a picture of how well he put himself in position to make birdies and how well he putted for birdies after a GIR. Let’s take a look at Martin Kaymer’s rounds at The Players Championship:
| Round | EBP | ABP | Gain |
| 1 | 44% | 53% | 8.8 |
| 2 | 32% | 38% | 6.9 |
| 3 | 26% | 18% | -7.7 |
| 4 | 34% | 23% | -11.3 |
His first two rounds were spectacular overall, and on the weekend he actually made fewer birdies than expected, even though every day except round 3 he put himself in great positions.
Remember these metrics are not meant to predict total score, just to give insight into a player’s ability to make birdies. It also doesn’t take into account (at the moment) field putting averages on those days, just overall yearly putting averages. If we look at the field averages for each round at The Players we see the following:
| Field | EBP | ABP | Gain |
| Round 1 | 33% | 32% | -1.4 |
| Round 2 | 29% | 24% | -5.7 |
| Round 3 | 32% | 33% | 0.9 |
| Round 4 | 32% | 29% | -3.1 |
In 3 out of 4 rounds players under-performed on the greens, possibly due to the putting difficulty, pin positions, weather, or faster green speeds at The Players.
The Expected Birdie Percentage is a method of evaluating a player’s chance of making a birdie after hitting a green in regulation–the higher the percentage the better his approach shots are. Actual Birdie Percentage then shows his success in converting those opportunities into birdies. It shows what birdie chances you are creating, how that compares to tour average, and how many of those you actually convert. What the data suggests is that long hitters have a big advantage in scoring on par 5’s; if their birdie probabilities are higher than other players, they will make more birdies over a large number of rounds than the field. The data certainly needs more detailed analysis, but this quick overview shows interesting patterns and can help players and coaches understand scoring a little better.
2014 EBP Rankings
| EBP Rank | Player Name | EBP | ABP | Gain |
| 1 | Watson, Bubba | 39.5% | 37.8% | -1.7 |
| 2 | McIlroy, Rory | 38.3% | 41.8% | 3.4 |
| 3 | Holmes, J.B. | 36.2% | 35.1% | -1.1 |
| 4 | Johnson, Dustin | 35.8% | 34.9% | -0.9 |
| 5 | Woodland, Gary | 35.8% | 31.4% | -4.3 |
| 6 | Rose, Justin | 35.5% | 32.8% | -2.7 |
| 7 | Matsuyama, Hideki | 34.9% | 37.7% | 2.9 |
| 8 | Glover, Lucas | 34.7% | 28.2% | -6.5 |
| 9 | Ishikawa, Ryo | 34.2% | 34.5% | 0.3 |
| 10 | Schwartzel, Charl | 34.1% | 37.8% | 3.7 |
| 11 | Peterson, John | 34.1% | 27.6% | -6.4 |
| 12 | Scott, Adam | 33.9% | 36.8% | 2.9 |
| 13 | Streelman, Kevin | 33.8% | 33.8% | 0.0 |
| 14 | Palmer, Ryan | 33.8% | 33.5% | -0.3 |
| 15 | Bradley, Keegan | 33.7% | 33.6% | -0.1 |
| 16 | Mickelson, Phil | 33.7% | 31.7% | -2.0 |
| 17 | Kirk, Chris | 33.6% | 33.8% | 0.2 |
| 18 | Kaymer, Martin | 33.5% | 30.9% | -2.6 |
| 19 | Dufner, Jason | 33.4% | 33.8% | 0.3 |
| 20 | Spieth, Jordan | 33.4% | 33.4% | 0.0 |
| 21 | Kokrak, Jason | 33.3% | 34.4% | 1.1 |
| 22 | Noh, Seung-Yul | 33.3% | 30.4% | -2.9 |
| 23 | Matteson, Troy | 33.2% | 30.0% | -3.2 |
| 24 | Watney, Nick | 33.2% | 28.9% | -4.2 |
| 25 | Hoffman, Charley | 33.1% | 33.5% | 0.4 |
| 26 | La’Cassie, Bronson | 33.1% | 28.5% | -4.6 |
| 27 | Guthrie, Luke | 33.0% | 32.0% | -1.0 |
| 28 | Moore, Ryan | 33.0% | 32.3% | -0.7 |
| 29 | Garrigus, Robert | 33.0% | 34.8% | 1.8 |
| 30 | Bae, Sang-Moon | 32.9% | 32.8% | -0.1 |
| 31 | Chappell, Kevin | 32.9% | 31.4% | -1.5 |
| 32 | Westwood, Lee | 32.9% | 32.3% | -0.6 |
| 33 | Hadley, Chesson | 32.9% | 32.6% | -0.3 |
| 34 | Beljan, Charlie | 32.6% | 31.1% | -1.5 |
| 35 | Mahan, Hunter | 32.6% | 30.6% | -2.0 |
| 36 | Stanley, Kyle | 32.6% | 25.7% | -6.8 |
| 37 | Walker, Jimmy | 32.5% | 37.7% | 5.2 |
| 38 | Roach, Wes | 32.5% | 30.9% | -1.6 |
| 39 | Stadler, Kevin | 32.4% | 30.8% | -1.6 |
| 40 | Fowler, Rickie | 32.4% | 31.5% | -0.9 |
| 41 | Leishman, Marc | 32.4% | 30.8% | -1.6 |
| 42 | Wilcox, Will | 32.3% | 28.9% | -3.3 |
| 43 | Brown, Scott | 32.2% | 33.0% | 0.8 |
| 44 | Bowditch, Steven | 32.2% | 30.1% | -2.2 |
| 45 | Poulter, Ian | 32.1% | 32.4% | 0.3 |
| 46 | Fritsch, Brad | 32.1% | 26.9% | -5.2 |
| 47 | Stallings, Scott | 32.1% | 29.5% | -2.6 |
| 48 | Steele, Brendan | 31.9% | 32.1% | 0.2 |
| 49 | Reed, Patrick | 31.9% | 30.5% | -1.4 |
| 50 | Lovemark, Jamie | 31.9% | 29.7% | -2.1 |
| 51 | Jones, Matt | 31.8% | 32.9% | 1.1 |
| 52 | Austin, Woody | 31.8% | 29.0% | -2.8 |
| 53 | Horschel, Billy | 31.8% | 28.9% | -2.9 |
| 54 | English, Harris | 31.7% | 31.6% | -0.1 |
| 55 | Putnam, Michael | 31.5% | 27.5% | -4.1 |
| 56 | Colsaerts, Nicolas | 31.5% | 30.4% | -1.0 |
| 57 | Sabbatini, Rory | 31.4% | 29.7% | -1.7 |
| 58 | Herman, Jim | 31.4% | 27.1% | -4.3 |
| 59 | Cauley, Bud | 31.4% | 29.0% | -2.4 |
| 60 | Gainey, Tommy | 31.4% | 29.5% | -1.9 |
| 61 | Davis, Brian | 31.4% | 33.5% | 2.2 |
| 62 | Na, Kevin | 31.3% | 33.2% | 1.8 |
| 63 | Lee, Danny | 31.3% | 29.9% | -1.4 |
| 64 | Lee, Richard H. | 31.3% | 29.9% | -1.4 |
| 65 | Villegas, Camilo | 31.2% | 32.0% | 0.7 |
| 66 | Perez, Pat | 31.2% | 31.8% | 0.6 |
| 67 | Svoboda, Andrew | 31.2% | 31.1% | -0.1 |
| 68 | Simpson, Webb | 31.2% | 35.0% | 3.9 |
| 69 | Johnson, Zach | 31.2% | 32.3% | 1.2 |
| 70 | McNeill, George | 31.2% | 31.7% | 0.6 |
| 71 | Barnes, Ricky | 31.1% | 30.4% | -0.7 |
| 72 | Els, Ernie | 31.1% | 29.1% | -2.0 |
| 73 | Weir, Mike | 31.1% | 28.3% | -2.8 |
| 74 | Loupe, Andrew | 31.1% | 34.9% | 3.9 |
| 75 | Pettersson, Carl | 31.0% | 30.4% | -0.6 |
| 76 | Bohn, Jason | 31.0% | 31.2% | 0.2 |
| 77 | Chopra, Daniel | 30.9% | 31.8% | 0.9 |
| 78 | Stroud, Chris | 30.9% | 31.4% | 0.5 |
| 79 | Harman, Brian | 30.9% | 31.7% | 0.8 |
| 80 | Blixt, Jonas | 30.9% | 29.3% | -1.6 |
| 81 | Henley, Russell | 30.9% | 32.0% | 1.1 |
| 82 | Laird, Martin | 30.9% | 29.7% | -1.2 |
| 83 | Van Pelt, Bo | 30.8% | 28.2% | -2.6 |
| 84 | Compton, Erik | 30.8% | 30.7% | -0.2 |
| 85 | Hearn, David | 30.8% | 30.0% | -0.8 |
| 86 | Hoffmann, Morgan | 30.8% | 33.7% | 2.9 |
| 87 | Stuard, Brian | 30.7% | 32.4% | 1.7 |
| 88 | Casey, Paul | 30.7% | 33.4% | 2.7 |
| 89 | Byrd, Jonathan | 30.6% | 29.0% | -1.6 |
| 90 | Ernst, Derek | 30.6% | 26.1% | -4.4 |
| 91 | Weekley, Boo | 30.6% | 25.2% | -5.4 |
| 92 | McGirt, William | 30.5% | 29.5% | -1.1 |
| 93 | Love III, Davis | 30.5% | 28.5% | -2.0 |
| 94 | Haas, Bill | 30.5% | 29.7% | -0.8 |
| 95 | MacKenzie, Will | 30.5% | 33.5% | 3.0 |
| 96 | Koepka, Brooks | 30.5% | 30.7% | 0.2 |
| 97 | Baddeley, Aaron | 30.5% | 32.6% | 2.1 |
| 98 | Every, Matt | 30.4% | 36.6% | 6.2 |
| 99 | O’Hair, Sean | 30.4% | 27.5% | -2.9 |
| 100 | Teater, Josh | 30.4% | 28.2% | -2.2 |
| 101 | Romero, Andres | 30.4% | 32.0% | 1.6 |
| 102 | Huh, John | 30.3% | 27.7% | -2.6 |
| 103 | Oosthuizen, Louis | 30.3% | 29.5% | -0.8 |
| 104 | Overton, Jeff | 30.3% | 31.4% | 1.2 |
| 105 | de Jonge, Brendon | 30.2% | 28.7% | -1.6 |
| 106 | Campbell, Chad | 30.2% | 23.3% | -7.0 |
| 107 | Potter, Jr., Ted | 30.2% | 25.3% | -5.0 |
| 108 | Thompson, Michael | 30.2% | 32.9% | 2.7 |
| 109 | Snedeker, Brandt | 30.2% | 29.3% | -0.9 |
| 110 | Cabrera, Angel | 30.2% | 31.9% | 1.7 |
| 111 | Lingmerth, David | 30.1% | 31.5% | 1.4 |
| 112 | Maggert, Jeff | 30.1% | 24.8% | -5.3 |
| 113 | Streb, Robert | 30.1% | 31.9% | 1.8 |
| 114 | Duke, Ken | 30.1% | 28.4% | -1.6 |
| 115 | Aragon, Alex | 29.9% | 29.8% | -0.2 |
| 116 | Appleby, Stuart | 29.9% | 33.3% | 3.4 |
| 117 | Castro, Roberto | 29.9% | 28.7% | -1.3 |
| 118 | Howell III, Charles | 29.9% | 30.9% | 0.9 |
| 119 | Van Aswegen, Tyrone | 29.9% | 30.6% | 0.6 |
| 120 | Harrington, Padraig | 29.9% | 30.3% | 0.4 |
| 121 | Swafford, Hudson | 29.9% | 28.0% | -1.9 |
| 122 | Gardiner, Scott | 29.8% | 29.0% | -0.8 |
| 123 | Driscoll, James | 29.8% | 31.1% | 1.3 |
| 124 | Kuchar, Matt | 29.8% | 32.9% | 3.1 |
| 125 | Langley, Scott | 29.8% | 29.0% | -0.8 |
| 126 | Flores, Martin | 29.8% | 28.5% | -1.3 |
| 127 | Prugh, Alex | 29.8% | 26.8% | -3.0 |
| 128 | DeLaet, Graham | 29.7% | 27.7% | -2.1 |
| 129 | Kelly, Jerry | 29.7% | 29.8% | 0.1 |
| 130 | Kisner, Kevin | 29.7% | 30.2% | 0.5 |
| 131 | Senden, John | 29.7% | 30.2% | 0.5 |
| 132 | Yang, Y.E. | 29.6% | 29.2% | -0.5 |
| 133 | Toms, David | 29.6% | 28.3% | -1.4 |
| 134 | Thompson, Nicholas | 29.6% | 26.1% | -3.5 |
| 135 | Herron, Tim | 29.6% | 27.1% | -2.5 |
| 136 | Tringale, Cameron | 29.5% | 28.1% | -1.3 |
| 137 | Summerhays, Daniel | 29.4% | 30.0% | 0.5 |
| 138 | Vegas, Jhonattan | 29.4% | 26.1% | -3.4 |
| 139 | Wi, Charlie | 29.4% | 29.5% | 0.1 |
| 140 | Cink, Stewart | 29.4% | 28.9% | -0.5 |
| 141 | Merrick, John | 29.4% | 25.6% | -3.8 |
| 142 | Points, D.A. | 29.3% | 27.3% | -2.0 |
| 143 | Ogilvy, Geoff | 29.3% | 29.6% | 0.3 |
| 144 | Hahn, James | 29.2% | 28.5% | -0.7 |
| 145 | Choi, K.J. | 29.1% | 33.0% | 3.8 |
| 146 | Singh, Vijay | 29.1% | 25.6% | -3.5 |
| 147 | Chalmers, Greg | 29.1% | 32.8% | 3.7 |
| 148 | Todd, Brendon | 29.1% | 31.5% | 2.4 |
| 149 | Knox, Russell | 29.0% | 28.5% | -0.5 |
| 150 | Wilkinson, Tim | 29.0% | 29.8% | 0.8 |
| 151 | Immelman, Trevor | 28.9% | 26.8% | -2.1 |
| 152 | Frazar, Harrison | 28.9% | 26.1% | -2.9 |
| 153 | Garnett, Brice | 28.9% | 29.3% | 0.4 |
| 154 | Martin, Ben | 28.9% | 31.0% | 2.1 |
| 155 | Williams, Lee | 28.9% | 26.8% | -2.1 |
| 156 | Mallinger, John | 28.8% | 25.0% | -3.8 |
| 157 | Fdez-Castano, Gonzalo | 28.8% | 32.5% | 3.7 |
| 158 | Rollins, John | 28.8% | 26.2% | -2.6 |
| 159 | Merritt, Troy | 28.8% | 26.0% | -2.8 |
| 160 | Clark, Tim | 28.7% | 28.8% | 0.1 |
| 161 | Gay, Brian | 28.7% | 29.3% | 0.6 |
| 162 | McDowell, Graeme | 28.7% | 31.3% | 2.6 |
| 163 | Renner, Jim | 28.6% | 29.5% | 0.9 |
| 164 | Lee, D.H. | 28.6% | 28.2% | -0.4 |
| 165 | Levin, Spencer | 28.6% | 27.5% | -1.1 |
| 166 | Lynn, David | 28.5% | 30.3% | 1.8 |
| 167 | Hanson, Peter | 28.4% | 28.6% | 0.2 |
| 168 | Crane, Ben | 28.3% | 28.4% | 0.1 |
| 169 | Malnati, Peter | 28.1% | 30.1% | 2.0 |
| 170 | Baird, Briny | 28.1% | 27.5% | -0.6 |
| 171 | Ogilvie, Joe | 28.0% | 30.3% | 2.3 |
| 172 | Furyk, Jim | 27.9% | 25.5% | -2.4 |
| 173 | Jacobson, Freddie | 27.9% | 30.1% | 2.2 |
| 174 | Collins, Chad | 27.7% | 28.0% | 0.4 |
| 175 | Donald, Luke | 27.7% | 32.3% | 4.7 |
| 176 | Clarke, Darren | 27.6% | 23.3% | -4.3 |
| 177 | Molder, Bryce | 27.6% | 27.2% | -0.3 |
| 178 | Allenby, Robert | 27.4% | 26.8% | -0.6 |
| 179 | Goosen, Retief | 27.2% | 29.0% | 1.8 |
| 180 | Wilson, Mark | 27.2% | 26.0% | -1.2 |
| 181 | Durant, Joe | 27.1% | 24.0% | -3.2 |
| 182 | Hurley III, Billy | 27.1% | 26.8% | -0.3 |
| 183 | Gates, Bobby | 27.1% | 23.9% | -3.2 |
| 184 | Loar, Edward | 27.0% | 27.4% | 0.4 |
| 185 | Slocum, Heath | 26.9% | 26.1% | -0.8 |
| 186 | Hicks, Justin | 26.9% | 26.1% | -0.8 |
| 187 | Wagner, Johnson | 26.8% | 25.5% | -1.3 |
| 188 | Leonard, Justin | 26.7% | 28.3% | 1.6 |
| 189 | Henry, J.J. | 26.6% | 23.1% | -3.5 |
| 190 | Woods, Tiger* | 26.3% | 37.8% | 11.5 |
| 191 | Curtis, Ben | 26.3% | 28.3% | 2.0 |
| 192 | Tway, Kevin | 25.8% | 25.8% | 0.0 |
| 193 | Ames, Stephen | 25.4% | 25.6% | 0.2 |
| 194 | Goydos, Paul | 24.6% | 21.1% | -3.5 |
| 195 | Verplank, Scott | 23.5% | 21.8% | -1.7 |
[1] data is from the 2014 season through the U.S Open, only players with at least 10 events plus Tiger Woods